
Second in an occasional series porting specific methods from Tony Ladson’s blog to Python — his explanation and the underlying method are his; this is a translation for readers who, like me, are more at home in Python than R. Read his original post for the real thing: Graphing a water balance (15 August 2017), R source in his gist.
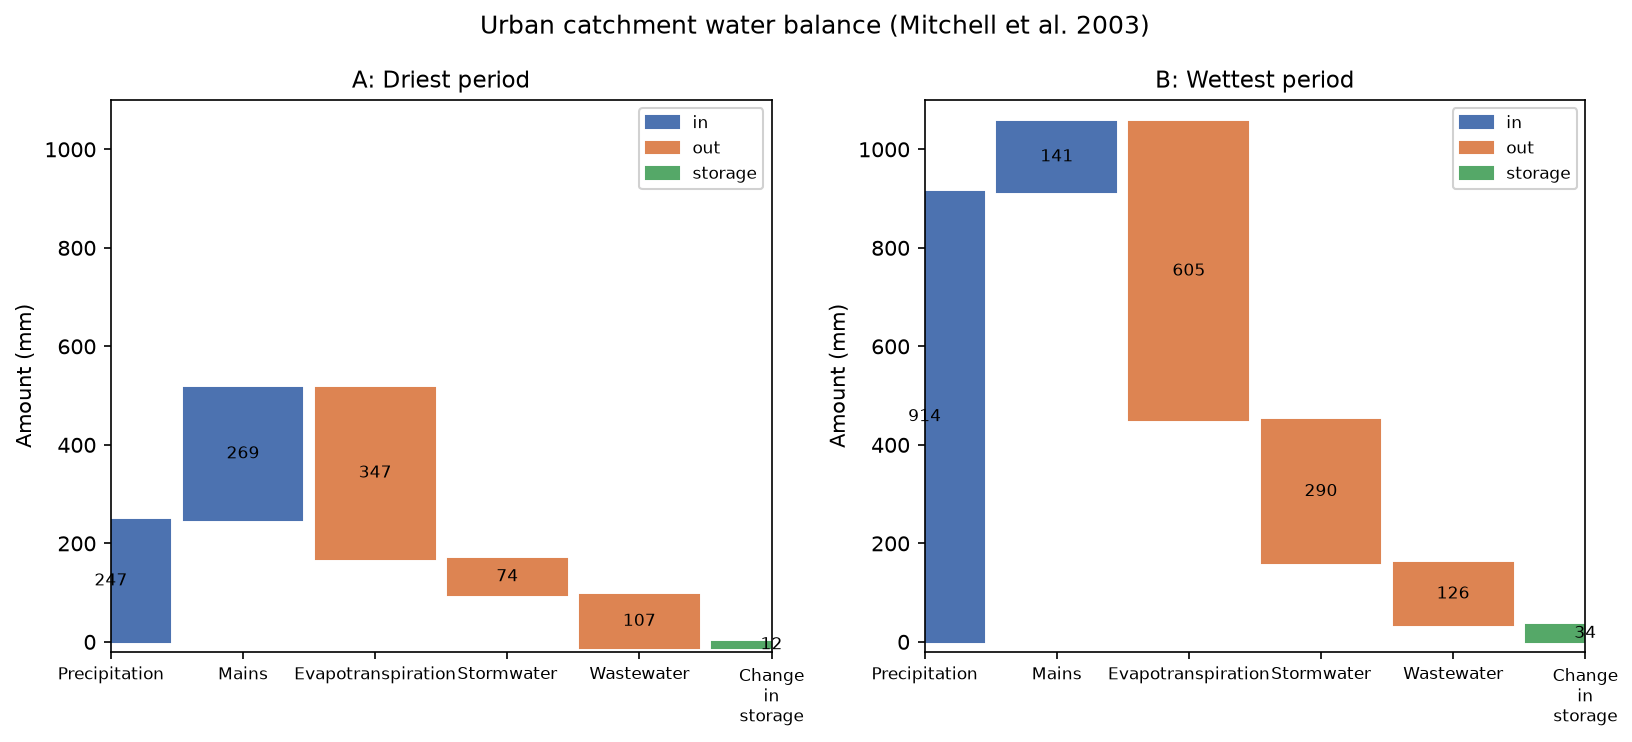
A water balance — precipitation and mains water in; evapotranspiration, stormwater and wastewater out; the residual attributed to a change in storage — is naturally a waterfall chart: each term is a bar that starts where the previous one ended. Ladson’s post builds one for two real example periods from Mitchell, McMahon & Mein’s 2003 study of an urban catchment’s total water balance.
The bar geometry
# Ladson's R
wb_end <- cumsum(amount)
wb_end <- replace(wb_end, length(wb_end), 0)
wb_start <- lag(wb_end)
wb_start <- replace(wb_start, 1, 0)
A running cumulative sum gives each bar’s start and end — except the last bar (change in storage), which is forced to end at exactly zero regardless of what the raw cumulative sum produces. That’s what makes the chart visually close.
import numpy as np

def waterfall_geometry(wb):
    """wb: dict of {term_name: signed_amount_mm}, outputs negative."""
    terms = list(wb.keys())
    amounts = np.array(list(wb.values()), dtype=float)
    wb_end = np.cumsum(amounts)
    wb_end[-1] = 0.0  # force the final bar to close at zero
    wb_start = np.roll(wb_end, 1)
    wb_start[0] = 0.0
    kinds = ['storage' if t == 'Change in storage' else ('in' if a > 0 else 'out')
             for t, a in zip(terms, amounts)]
    return terms, amounts, wb_start, wb_end, kinds
Does it actually close?
Forcing the last bar to end at zero is a drawing convention — it makes the chart close regardless of whether the underlying numbers do. That’s worth checking separately, since the water balance equation says the five flux terms (Precipitation + Mains − Evapotranspiration − Stormwater − Wastewater) should sum to exactly the reported change in storage:
driest = {"Precipitation": 247, "Mains": 269, "Evapotranspiration": -347,
          "Stormwater": -74, "Wastewater": -107, "Change in storage": 12}
wettest = {"Precipitation": 914, "Mains": 141, "Evapotranspiration": -605,
           "Stormwater": -290, "Wastewater": -126, "Change in storage": 34}

for name, wb in [('Driest', driest), ('Wettest', wettest)]:
    terms_list = list(wb.items())
    total_flux = sum(v for _, v in terms_list[:-1])
    reported = terms_list[-1][1]
    print(f'{name}: flux sum={total_flux:+.0f} mm, reported storage change={reported:+.0f} mm')
Driest:  flux sum=-12 mm, reported storage change=+12 mm   -> 24 mm gap
Wettest: flux sum=+34 mm, reported storage change=+34 mm   -> closes exactly
The wettest period closes exactly. The driest one doesn’t — a real 24 mm gap between what the five measured terms sum to and the reported storage change. That’s not a problem with Ladson’s chart, which never claims otherwise; it’s an honest feature of real observational water balance data, where “change in storage” often works partly as a residual/catch-all rather than something measured to the same precision as the other terms. Worth knowing before reading too much precision into any single waterfall chart — this one included.
Companion notebook: notebooks/09_water_balance_waterfall/
Source: Ladson, A.R. (2017). Graphing a water balance. R source: gist.github.com/TonyLadson/4d42e2cedc20aa1ff04a06631af88551.
Reference: Mitchell, V.G., McMahon, T.A. & Mein, R.G. (2003). Components of the Total Water Balance of an Urban Catchment. Environmental Management 32(6): 735–746.