
As the 2024/25 wet season came to a close in North Queensland, I ran a comparative analysis across historical SILO records to put the season’s rainfall sequences in context. The question was simple: how does this year’s accumulation compare to every previous water year on record?
What the Data Shows
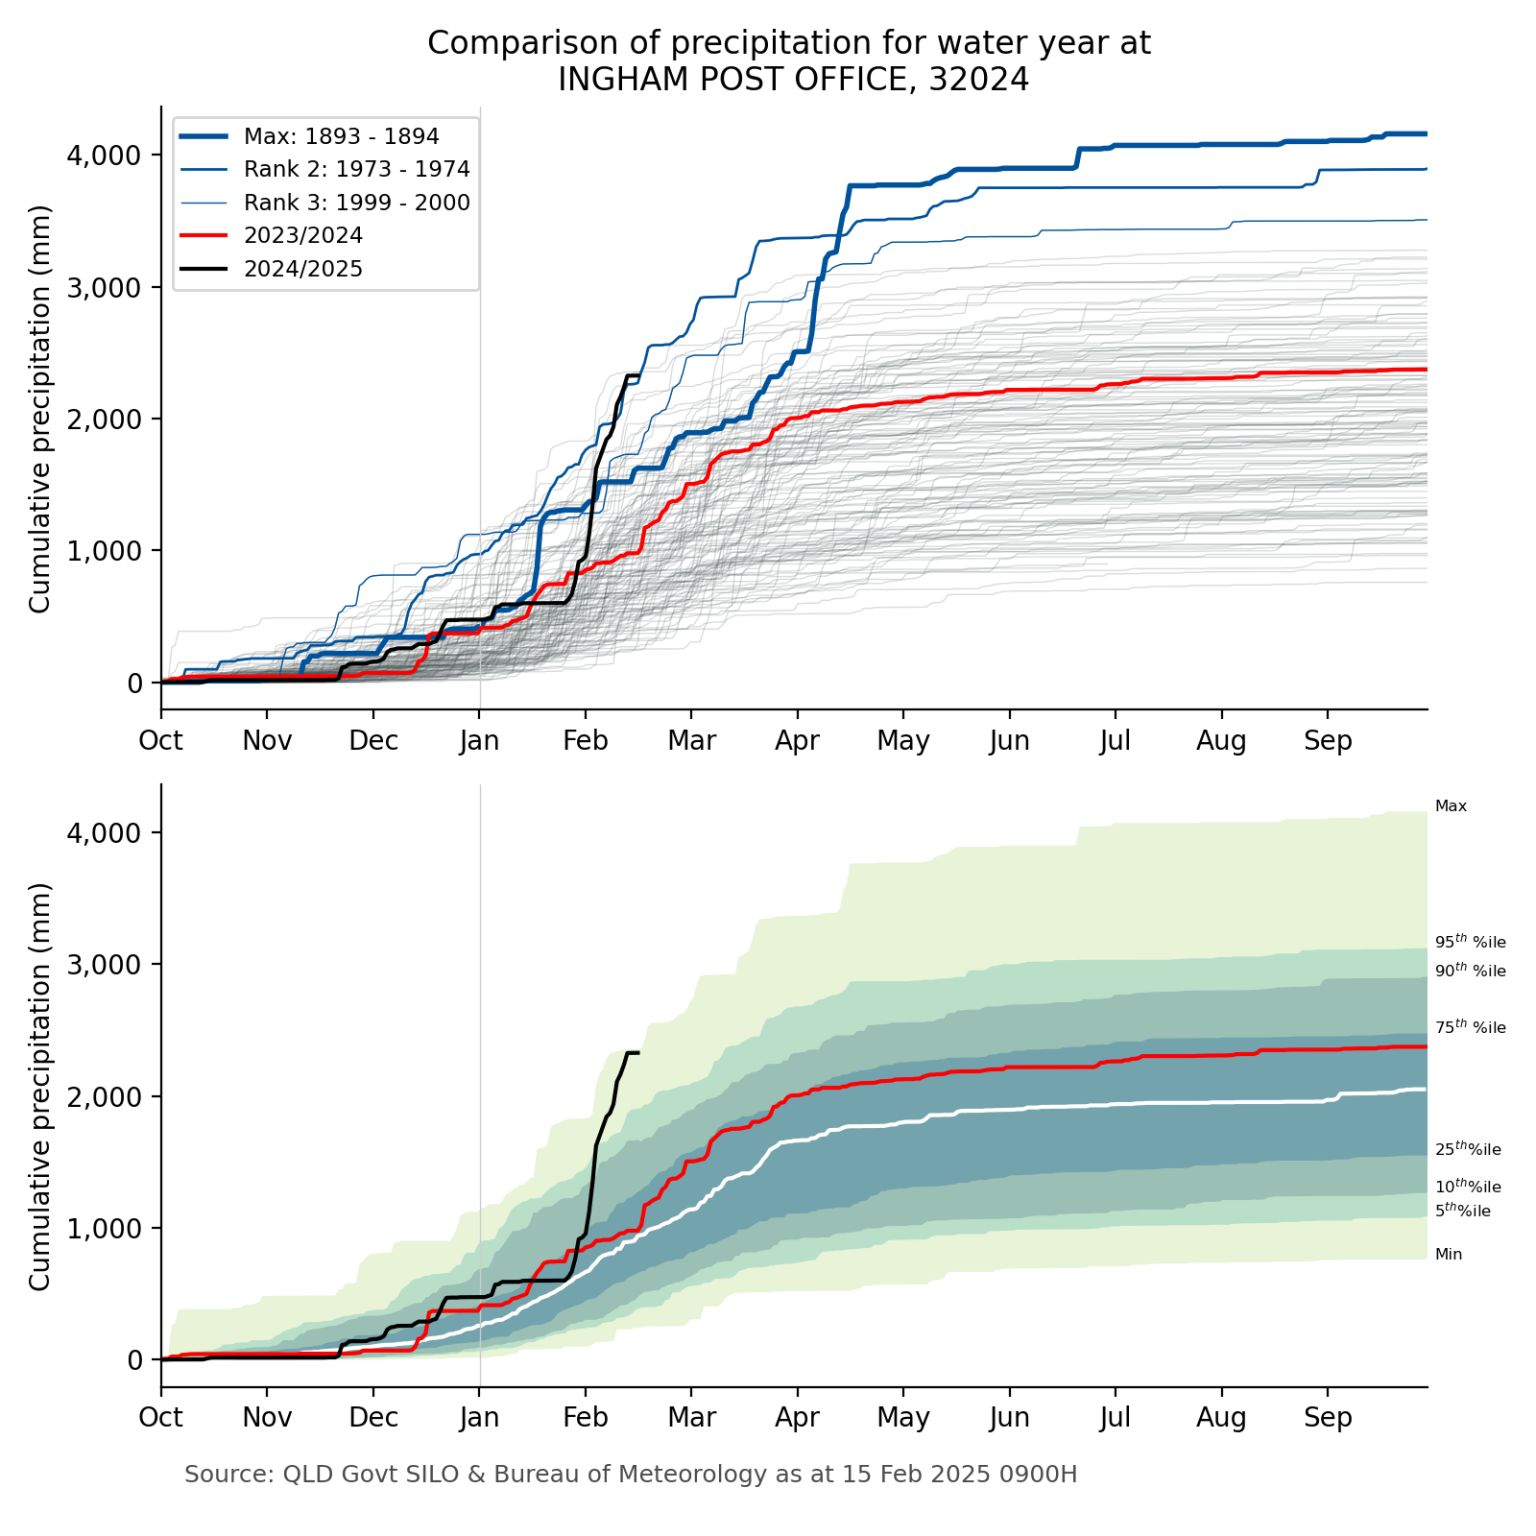
At all three coastal gauges — Ingham, Paluma and Townsville — the 2024/25 season tracked at or near the maximum accumulation for the water year in the historical record. The comparison years at the top of the distribution are 1893-94, 1973-74 and 1999-2000 — genuinely exceptional wet seasons in the long-term record.
By mid-February the 2024/25 season was sitting within the top percentiles of historical accumulation at Ingham. By the end of May it should be clear whether this becomes the wettest year on record at these gauges.
The Spatial Contrast: Ross River Dam
What’s particularly interesting from a water resource management perspective is the spatial variability within North Queensland. The Ross River Dam catchment, measured at Laudhan Park (further south and inland from the coast), tells a different story — the 2024/25 sequence wasn’t tracking as wet as the 2018/19 event at that location.
This isn’t surprising from a meteorological perspective — the dominant rainfall mechanisms in the region (tropical cyclones, monsoon troughs, cut-off lows) produce highly variable spatial distributions. But it has direct implications for water storage operations: a near-record rainfall season at coastal gauges doesn’t necessarily translate to near-record inflows for the major water supply storages serving Townsville.
Why Cumulative Plots Matter
The percentile fan plot (bottom panel) is particularly useful for operational hydrology and communicating risk in real time during a wet season. It answers the question “how unusual is this rainfall sequence so far” rather than waiting for a final annual total.
For dam operators and flood forecasters, tracking where the current season sits against the historical fan through the wet season informs:
- Antecedent moisture state — if you’re tracking in the 95th percentile by January, soil saturation is likely near maximum and runoff coefficients for subsequent events will be high
- Storage trajectory — is this season likely to challenge spillway design events, or is it a moderate recharge year?
- Operational posture — when does the trajectory warrant moving from routine to enhanced monitoring?
This type of historical benchmarking analysis is straightforward to run against the SILO Patched Point Dataset for any gauge in Australia. If you want the approach applied to your region, get in touch.
Data: QLD Government SILO Patched Point Dataset & Bureau of Meteorology. Data as at 15 February 2025 0900H. Originally shared on LinkedIn — 61 reactions.