
When the Australia v India Brisbane Test Match was imminent, I decided the obvious thing to do was pull 136 years of SILO data for the Gabba and ask the question hydrologists ask about everything: what does the historical record actually say?
The specific question: on any given day in late November, what fraction of years on record produced a wet day at the Gabba? And how does that vary through the day-of-month and month?
The Metric
A wet day here is defined as daily rainfall exceeding 10mm — the threshold that typically produces meaningful disruption to outdoor events. Trace events (dew, brief showers, instrument noise) are excluded.
Using the 10mm threshold is deliberate. In a cricket context, 1mm overnight doesn’t affect the pitch or outfield. 10mm in a session does.
The Heatmap
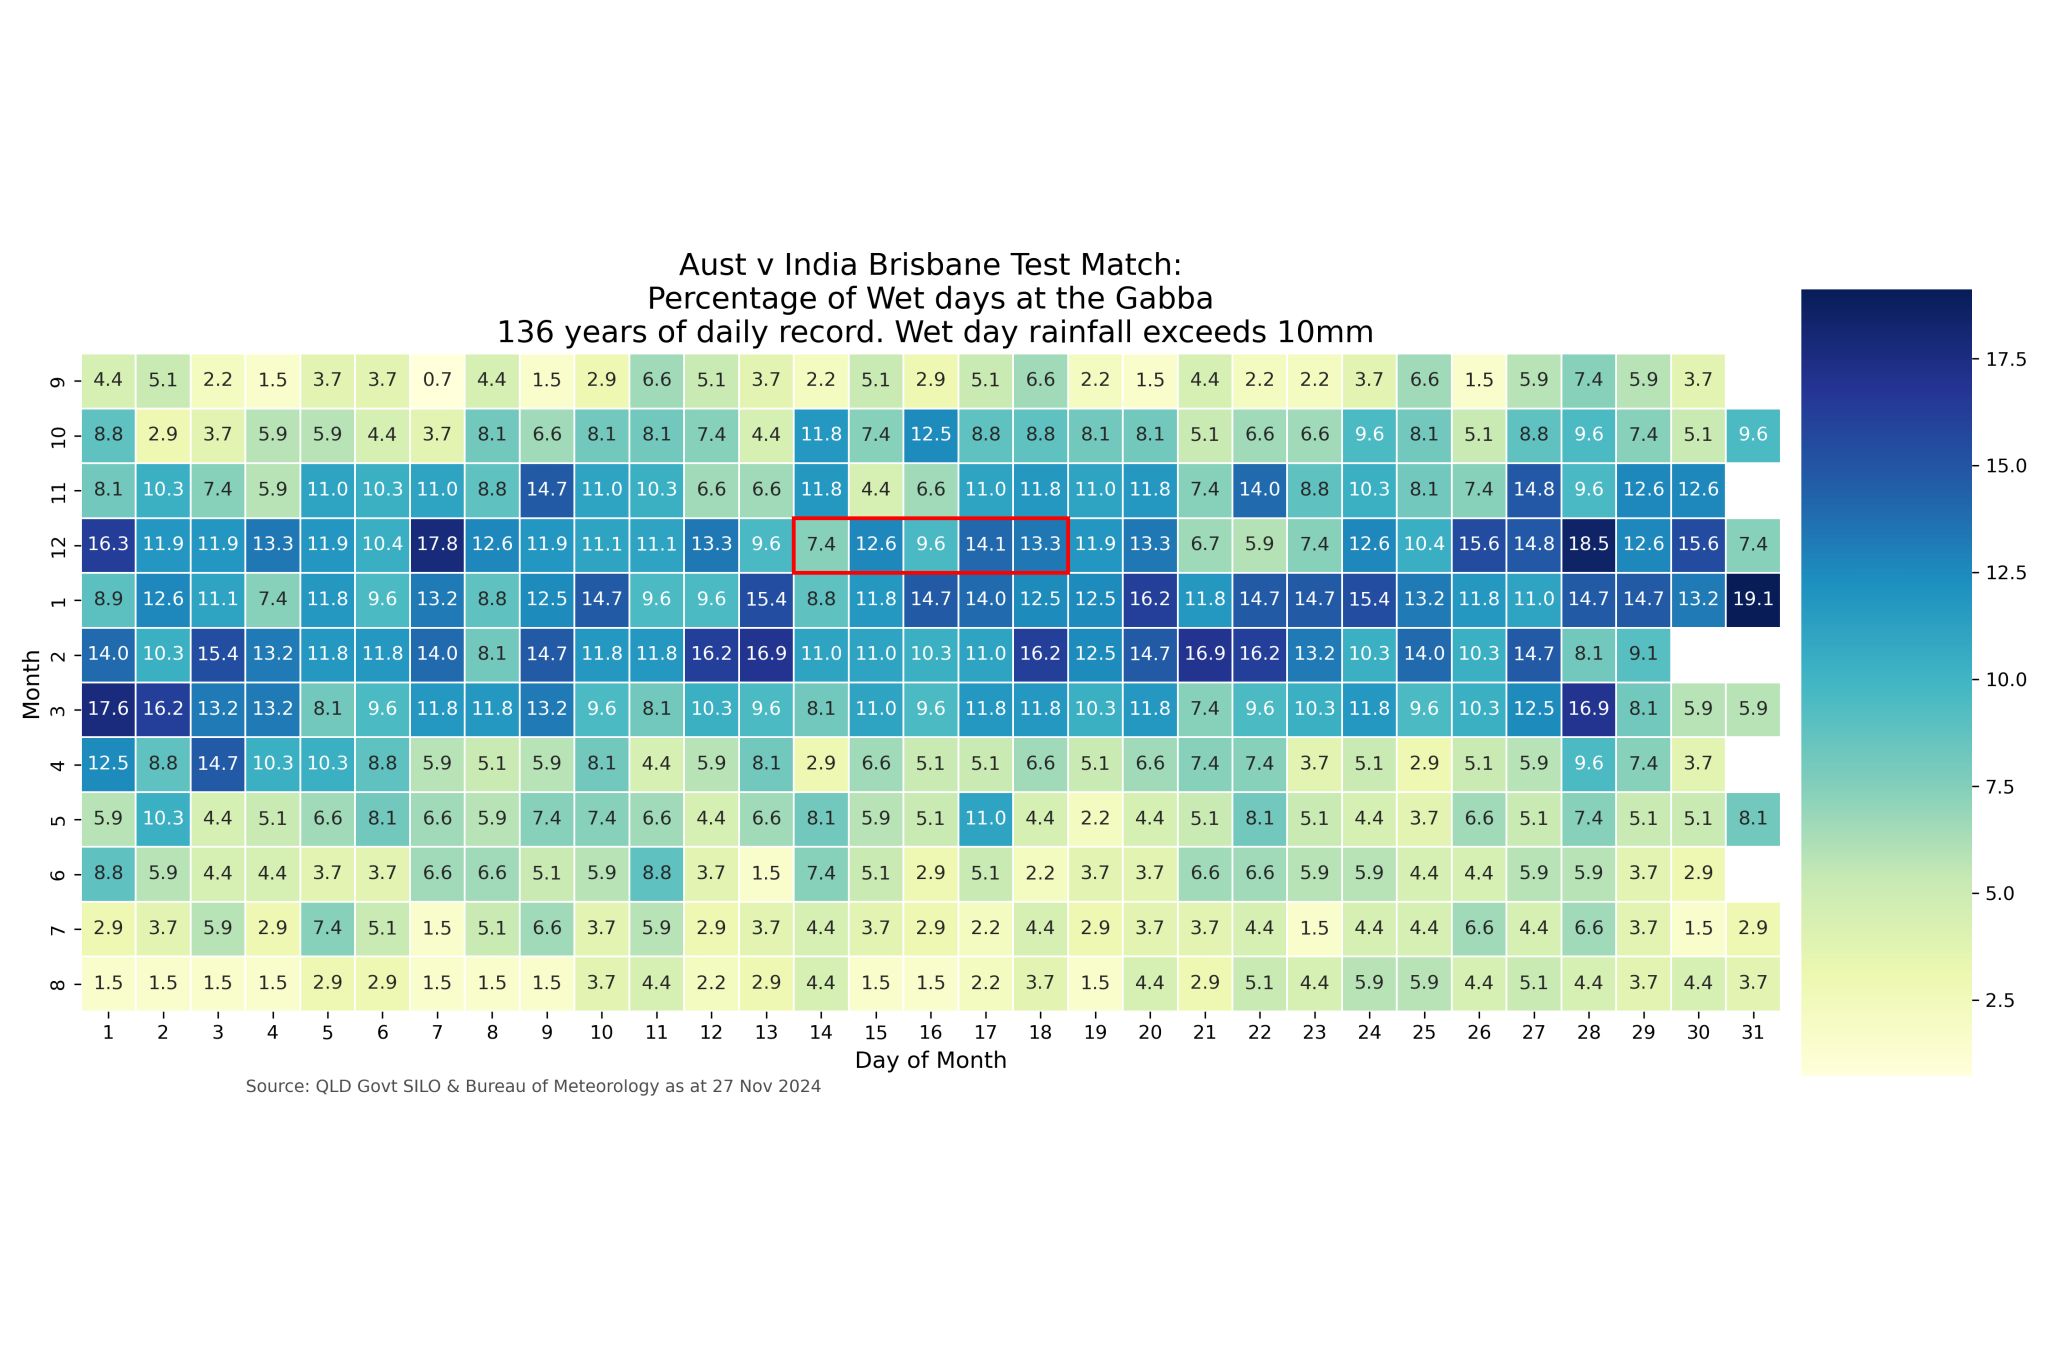
The heatmap shows wet day probability by day of month (x-axis) and month (y-axis). The colour intensity scales with frequency — darker cells indicate days where a 10mm+ rainfall event occurred more often across the historical record.
What the Data Shows
Late November — when the Gabba typically hosts the first Test of the Australian summer — sits in a shoulder period. The monsoon hasn’t established, but the subtropical convective season is beginning. The historical record shows:
- Wet day probability in late November is moderate but not negligible: around 10–15% for any given day at the 10mm threshold
- The January–March period shows substantially higher wet day frequency — the climatological peak of Queensland’s wet season
- The May–September period shows the lowest wet day frequency, consistent with Brisbane’s dry season
The Engineering Relevance
This kind of analysis — historical frequency of exceedance at a threshold level, disaggregated by time of year — is the same methodology we use for assessing operational risk on infrastructure construction programs, determining when earthworks can proceed, and planning bridge inspections that require low-flow conditions.
Cricket groundsmen use intuition and experience. Engineers should use data. For Brisbane, the data says late November is a better scheduling window than February — but it’s not a guarantee.
Data: QLD Government SILO Patched Point Dataset & Bureau of Meteorology. Record as at 27 November 2024. Originally shared on LinkedIn.