
The problem with embedded bursts
ARR 2019’s ensemble temporal patterns exist to represent the natural variability of how rainfall is distributed through a design storm — running all 10 patterns for a duration and taking the median (or a specific percentile) of the resulting flood peaks is standard practice, precisely because no single pattern is “correct” and the ensemble is the point.
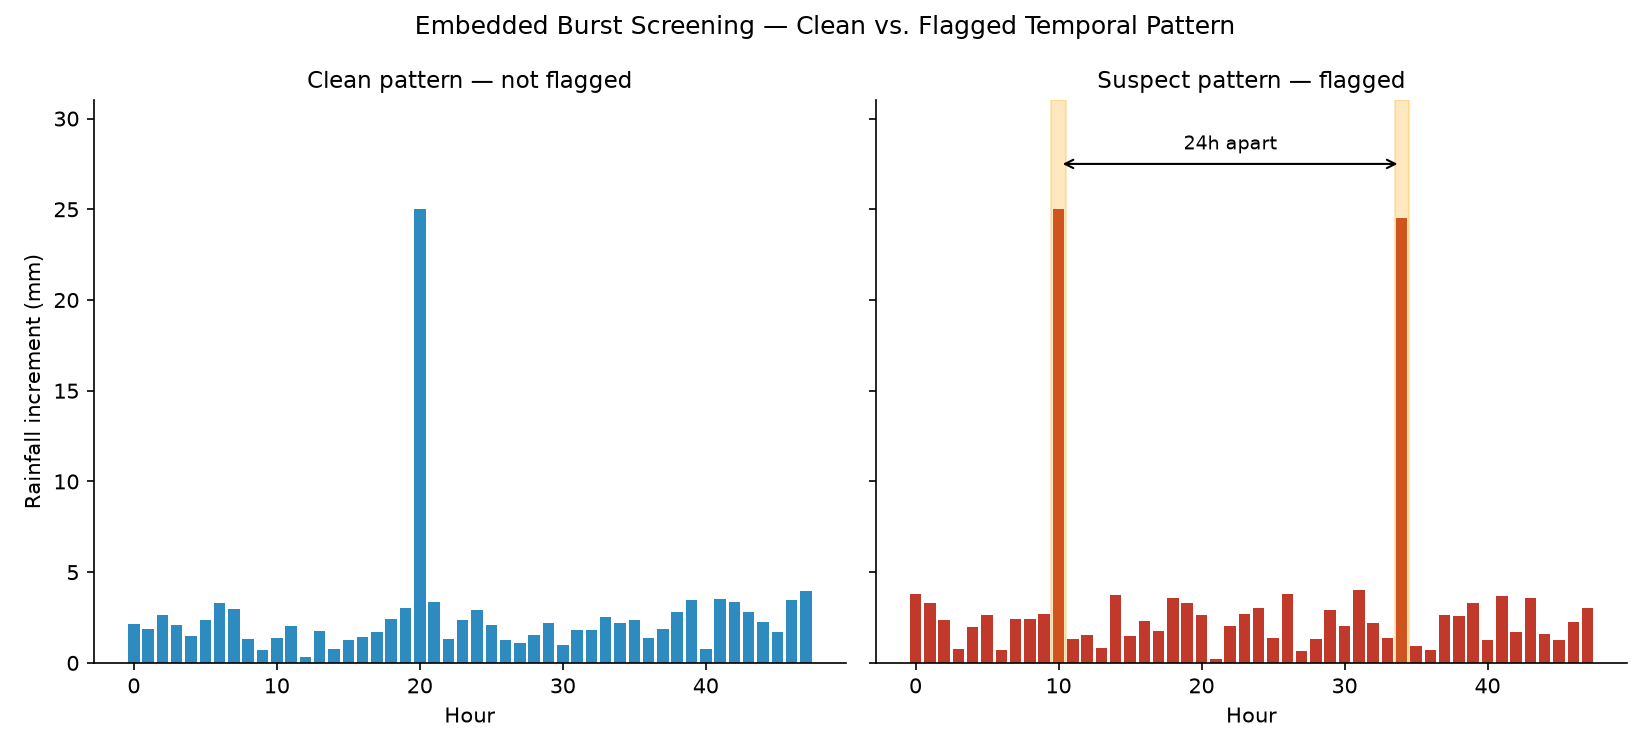
Some patterns in the ARR temporal pattern set have a specific, recognisable error signature: two large rainfall bursts sitting suspiciously close to exactly 24 hours apart. That’s not a natural storm characteristic — real storms occasionally do produce multiple intense bursts, but a near-exact 24-hour separation between the two largest increments is a signature of how some patterns were extracted from historical pluviograph records, not a physical feature of the storm itself. Run that pattern through a runoff-routing model and you can get a double-peaked or artificially inflated flood hydrograph that has nothing to do with the catchment’s actual response — it’s an artefact of the input, not a result worth reporting.
Ladson (2021) documents this issue in more detail than covered here; treat the screening function below as a first-pass triage tool that tells you which patterns are worth a closer look, not a substitute for reading that paper if you’re screening patterns for something that matters.
The screening algorithm
import numpy as np

def screen_embedded_bursts(increments, timestep_hours, flag_window_hours=24, tolerance_hours=1.5):
    """Flag a temporal pattern for a suspected embedded-burst error.

    Finds the two largest rainfall increments in the pattern and checks
    whether they sit suspiciously close to `flag_window_hours` apart -- the
    signature of a duplication/extraction artefact rather than a genuine
    double-peaked storm. Screening heuristic, not a proof of error: see the
    note on Ladson (2021) above before treating a flag as definitive.

    Parameters
    ----------
    increments : array-like
        Rainfall depth increments at each timestep (any consistent unit).
    timestep_hours : float
        Duration of each increment, in hours.
    flag_window_hours : float
        The suspicious separation to screen for (default 24h).
    tolerance_hours : float
        How close to `flag_window_hours` counts as a match.
    """
    increments = np.asarray(increments, dtype=float)
    order = np.argsort(increments)[::-1]
    idx1, idx2 = order[0], order[1]
    time1, time2 = idx1 * timestep_hours, idx2 * timestep_hours
    separation = abs(time1 - time2)
    flagged = abs(separation - flag_window_hours) <= tolerance_hours
    return {
        "flagged": bool(flagged),
        "largest_increment": float(increments[idx1]),
        "largest_time_hr": float(time1),
        "second_increment": float(increments[idx2]),
        "second_time_hr": float(time2),
        "separation_hr": float(separation),
    }
Two known-answer test cases before trusting it on anything real:
rng = np.random.default_rng(0)

# A clean, single-peaked pattern -- should NOT flag
clean = np.abs(rng.normal(2, 1, 48))
clean[20] = 25.0
assert screen_embedded_bursts(clean, timestep_hours=1)["flagged"] is False

# A pattern with a duplicated burst 24h apart -- SHOULD flag
suspect = np.abs(rng.normal(2, 1, 48))
suspect[10] = 25.0
suspect[34] = 24.5
assert screen_embedded_bursts(suspect, timestep_hours=1)["flagged"] is True
Both pass.
Visualisation: suspect versus clean patterns
Recommended workflow
Screen every pattern in a duration’s ensemble before you commit to a full ensemble run, not after you’ve already generated results and are wondering why one pattern’s peak looks strange. A flagged pattern isn’t automatically wrong — inspect it, and if it genuinely looks like an extraction artefact rather than a plausible storm, that’s a defensible basis to note it in your methodology and either exclude it or flag the sensitivity it introduces, rather than silently averaging it into an ensemble median as if it were an equally trustworthy input.
Accessing ARR temporal patterns — over to you
This is the one piece I couldn’t complete without ARR Data Hub access, which isn’t available in the environment this was drafted in. The screening function above works on any array of rainfall increments regardless of source — manually exported from the ARR Data Hub web tool, or pulled programmatically if you’re set up with requests against the Data Hub API. If you wire up the API retrieval, the natural extension is a loop that pulls all 10 patterns for a duration, runs each through screen_embedded_bursts, and prints a one-line summary per pattern — straightforward to add once the retrieval side is sorted, and a good candidate for a follow-up post once it’s built and tested against real patterns.
Limitations
- This screens for one specific, recognisable error signature (near-24h duplicate bursts). It is not a general-purpose temporal pattern QA tool — a pattern that passes this check can still have other problems.
flag_window_hours=24andtolerance_hours=1.5are reasonable starting defaults, not values validated against the full ARR pattern set — tighten or loosen based on what you see when you actually run this against real patterns.- Always read a flagged pattern’s hyetograph before deciding what to do with it. This function tells you where to look, not what to conclude.
Reference: Ladson, A.R. (2021). Review of temporal patterns from Australian Rainfall and Runoff 2019. 39th Hydrology and Water Resources Symposium.